SAMPLE LESSONS > O LEVEL KINEMATICS
GRAPHING
For maximum learning experience, download the notes and watch the video lessons.
Remember to scroll down for in-depth learning via the worked examples.
WORKED EXAMPLES
EASY
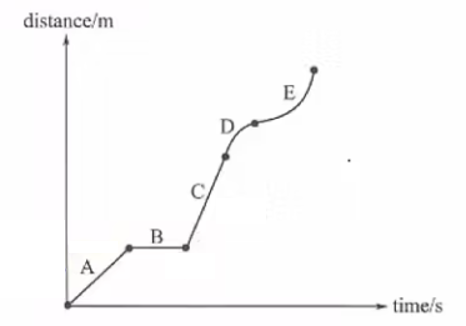
The distance-time graph bellow shows the movement of a car.
Describe the movement of the car in terms of speed.

Answer
MEDIUM
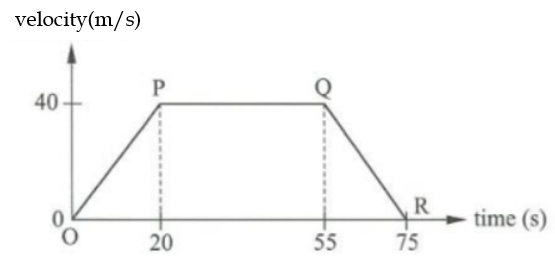
The motion of a train is depicted in the following velocity-time graph.

a) Determine the acceleration between O and P.
b) Determine the acceleration between P and Q.
c) What is the total distance travelled by the train from O to R?
d) Calculate the average speed of the train.
Answer
HARD
A car accelerates to a velocity of 20 m/s in 10 s from rest. It then continues with this constant speed for 20s before decelerating to a stop in t s.
a) Sketch the speed-time graph for the motion.
b) If the car has a deceleration of 5 m/s2, determine t.
c) Calculate the average speed of the motion.
Answer
The lessons and resources above are just the tip of the iceberg.
Nothing is better than tasting Physics Academy’s live lessons & accessing the full version of our digital resources. Sign Up for a FREE Trial Class & Experience the Best Physics Lesson Yourself!
START YOUR FREE TRIAL

Mr. Bryan Lai
FOUNDER OF PHYSICS ACADEMY
Over the past 15 years, my students remember me as the “Go-To” Master Physics Tutor who has consistently helped over 1,280 students achieved Distinctions for Secondary & JC A Level in just 6-9 Months, regardless of their current exam grades.
All thanks to my Physics Prof Learning System which allow students to learn Physics 24/7 anytime, anywhere! By combining Weekly Classroom Lessons, Digital Lessons, Physics Compendium (AKA Physics Bible), and FREE Consultations. I’ve helped my students clarify all their doubts & skyrocket their results in a very short time.
Please fill in your details.
